Graphical User Interface
Due to the computational demands of simulating many individuals at high temporal and spatial resolution, Persefone.jl is primarily designed to be run non-interactively on an HPC. However, to allow interactive exploratory simulations to be conducted while learning or developing the model, a graphical user interface is available as an additional package: Persefone Desktop.
Please note that Persefone Desktop has not yet been updated to work with model versions newer than Persefone.jl 0.8.
Quick start
Follow these instructions if you simply want to try out the software as a user. If you want to play around with the source code, see the next section.
- Download the Julia programming language and install it on your computer.
- Start Julia. This should launch a commandline interface/REPL.
- Execute the following commands (copy-and-paste should work):
using Pkg
Pkg.add(url="https://git.idiv.de/persefone/persefone-model.git")
Pkg.add(url="https://git.idiv.de/persefone/persefone-desktop.git")
using PersefoneDesktop
ENV["QSG_RENDER_LOOP"] = "basic" # only needed on Windows
launch()
Running from the repo
Follow these instructions if you want to get to grips with the source code. For more detailed installation instructions, see here.
To install: Install Julia and download/clone the repository. Open a Julia REPL in the downloaded folder and execute the following to install all dependencies:
using Pkg
Pkg.activate(".")
Pkg.instantiate()
To run: Run desktop.jl. Alternatively, open a Julia REPL in this folder and run:
using Pkg
Pkg.activate(".")
using PersefoneDesktop
launch()Due to the necessary pre-compilation done by Julia, installing and launching the application can take quite a long time (currently about 2 minutes). We will reduce this as much as possible in future releases.
User interface
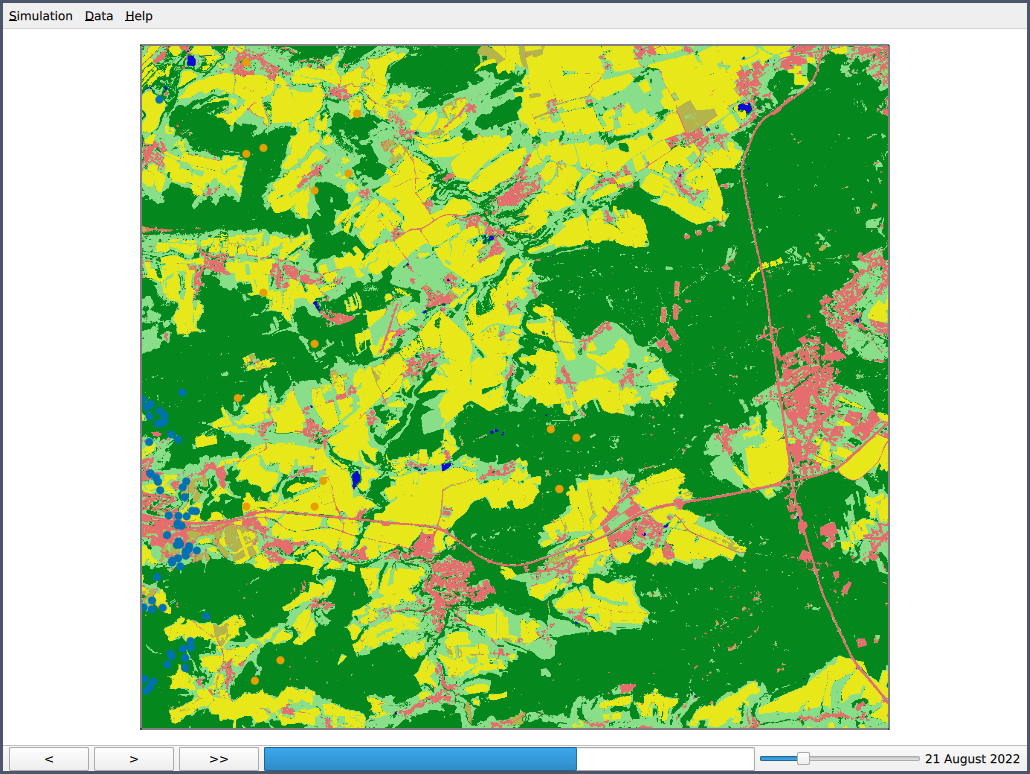
The main window component is the map view. This displays a land cover map of the simulated region: dark green are forests, light green grassland, yellow fields, red built-up areas and blue water. On it, little circles show the position of individual animals, with different species denoted by different colours.
Control bar
Back button: Rewind the simulation by one day.
Step button: Advance the simulation by one day.
Run button: Run the simulation until the button is pressed again or the end date is reached.
Progress bar: Shows the percentage of time elapsed between the start and end dates of the simulation.
Speed slider: Set the time delay between each simulation step when running.
Date: Shows the simulation date currently displayed on the map.
Menu bar
Simulation:
New simulation: Reset the model and start over.
Configure simulation: Change the model settings (not yet implemented).
Load saved state: Load a model object file saved by a previous simulation run.
Save current state: Save a model object file for later use.
Quit: Close the application.
Data:
Show population graph: Show a window with a graph of population sizes over time in the current model run.
Save simulation output: Save the model output data to file (saves both raw CSV data and generated graphics).
Help:
Documentation: Open the Persefone.jl online documentation in a browser.
Website: Open the main Persefone.jl website in a browser.
About: Show a window with core information about the application.